This paper presents a systematic deep learning study for four-class facial emotion recognition (Happy, Neutral, Sad, Surprise) applied to 48×48 pixel grayscale images. Six architectures were evaluated: an ANN baseline, two custom CNNs, three transfer learning models (VGG16, ResNet50V2, EfficientNetB0), and a purpose-built Complex CNN with five convolutional blocks, batch normalization, and data augmentation.
The Complex CNN achieved 82.03% test accuracy (Macro F1: 0.82) on a balanced 128-image test set, outperforming the best transfer learning model by 21.87 percentage points. The primary failure mode — Neutral/Sad confusion — reflects documented human perception limits at low-intensity affect.
🚌
The model is proposed as the inference core of an open-source, edge-deployable driver monitoring system for public transportation fleets, with a 5-year total cost of ownership estimated at 36–66% lower than commercial alternatives for a 10,000-vehicle fleet.
Problem Statement
Four emotions, one classification task
The technical task is a four-class image classification problem. Given a 48×48 pixel grayscale image of a human face, the model must predict one of four emotion labels. In the driver monitoring context, each class maps directly to a safety state.
😊
Happy
Alert and engaged — nominal operating state
😐
Neutral
Baseline — monitoring for degradation
😔
Sad
Fatigue onset — primary detection target
😮
Surprise
Sudden event response — hazard or near-miss
⚠️
The Neutral/Sad boundary is separated by only 3.27 mean pixel intensity points out of 255. Their standard deviations are nearly identical (~64 units), so the distinguishing information is spatial, not intensity-based. That's the core reason fully connected networks don't work here.
Why It Matters
Driver fatigue contributes to 17.6% of all fatal crashes in the United States (AAA Foundation, 2024), with an annual societal cost of $109 billion (NHTSA). In public transportation — school buses carrying 21.4 million US children daily, 65,000 transit buses serving cities nationwide — a single fatigue-related incident carries severe human and financial consequences.
The EU General Safety Regulation mandated driver monitoring systems on all new vehicles from July 2024. The US NHTSA is developing parallel requirements. Governments are not deciding whether to adopt this technology — they are deciding how to procure it.
Dataset
20,214 Facial Images Across 4 Classes
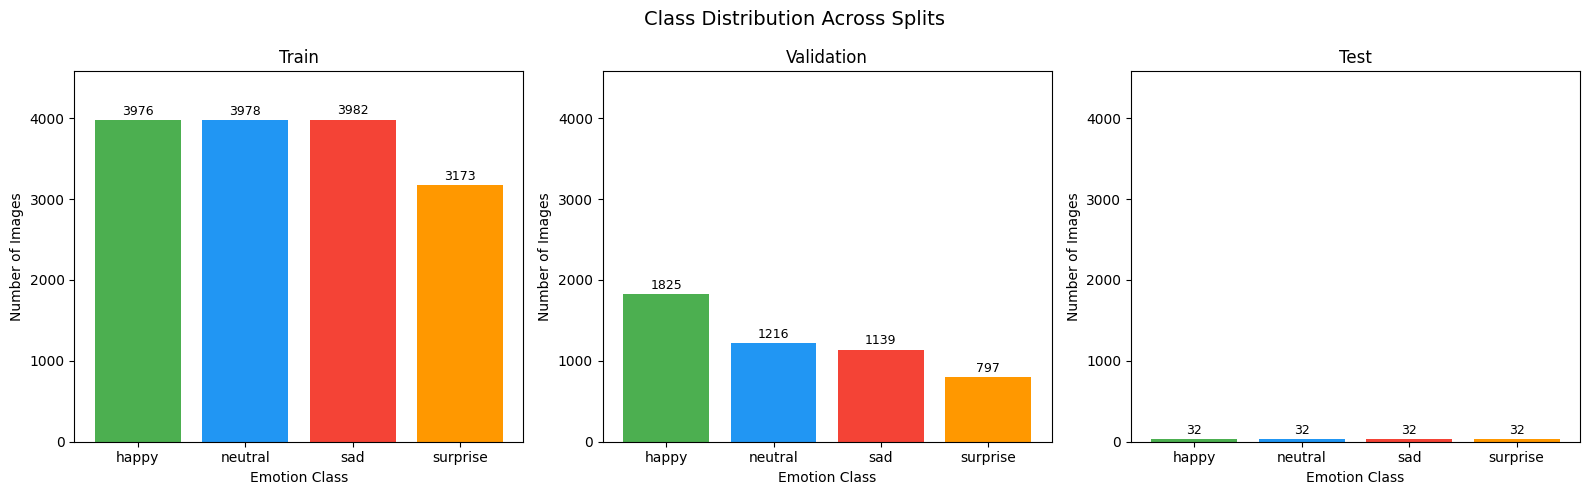
All images are 48×48 pixels in grayscale format. The test set is perfectly balanced at 32 images per class, ensuring accuracy figures are not inflated by any majority class.
Split
Total
Happy
Neutral
Sad
Surprise
Training
15,109
3,976
3,978
3,982
3,173
Validation
4,977
1,825
1,216
1,139
797
Test
128
32
32
32
32
Total
20,214
5,833
5,226
5,153
4,002
Figure 1. Image count per class across training, validation, and test splits.
Pixel Intensity Analysis
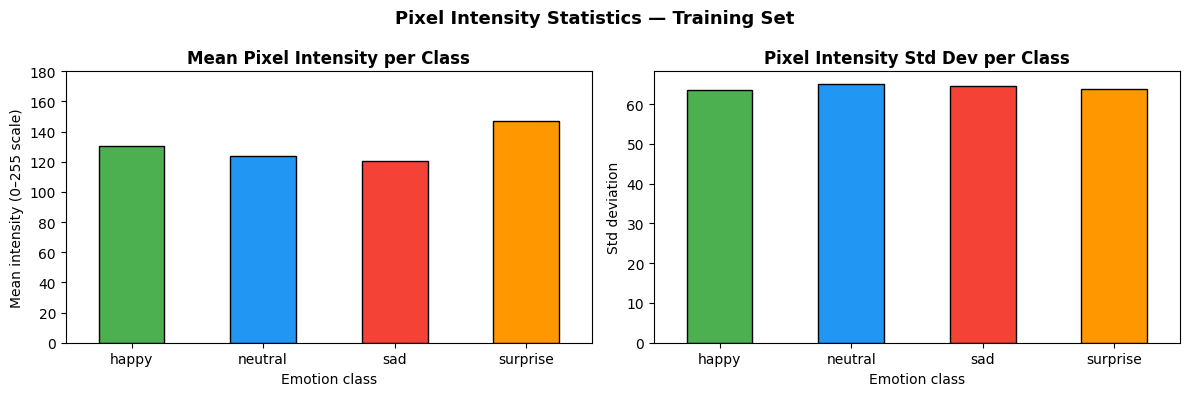
Per-class pixel statistics reveal the core classification challenge. Mean intensity values differ only modestly, and standard deviations are nearly uniform — confirming that spatial structure, not brightness, is the discriminative signal.
Class
Mean Intensity
Std Dev
Visual Characteristics
😊 Happy
130.62
63.59
Most visually distinct — broad smiles, Duchenne markers
😐 Neutral
123.99
64.98
Defined by absence of expression — most ambiguous class
😔 Sad
120.72
64.63
Only 3.27 points below Neutral mean
😮 Surprise
147.25
63.90
Brightest class — wide eyes, open mouth
Figure 2. Mean pixel intensity ± standard deviation per class (first 500 training images each).
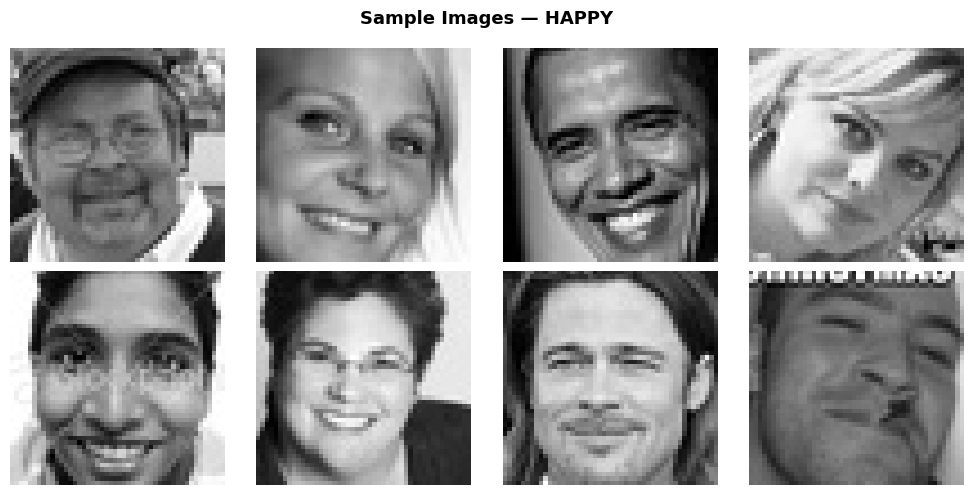
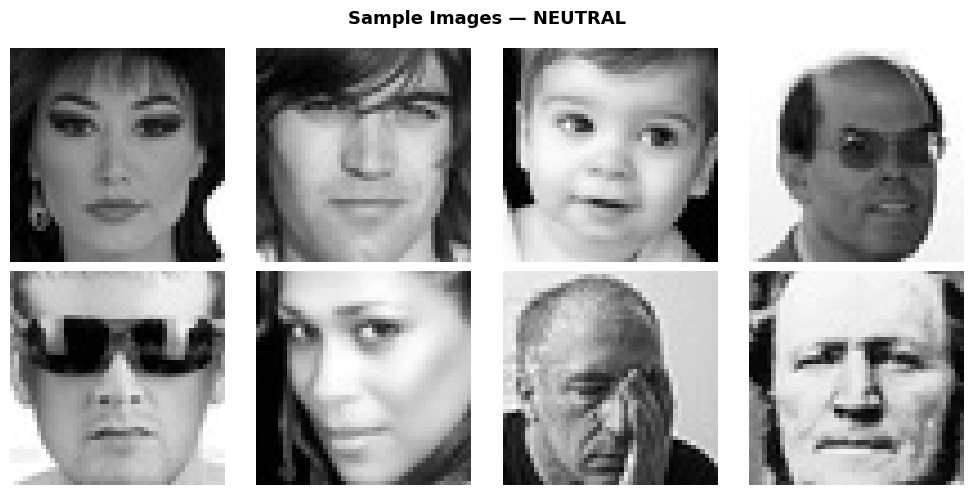
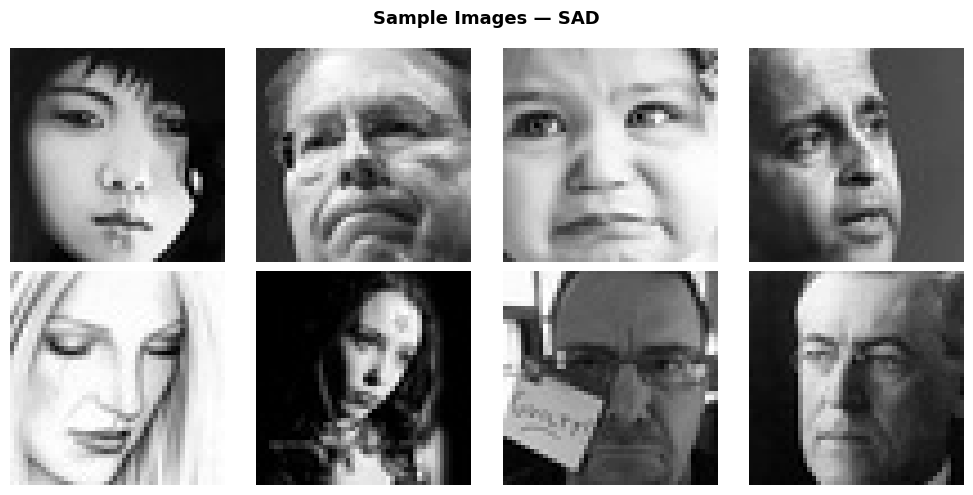
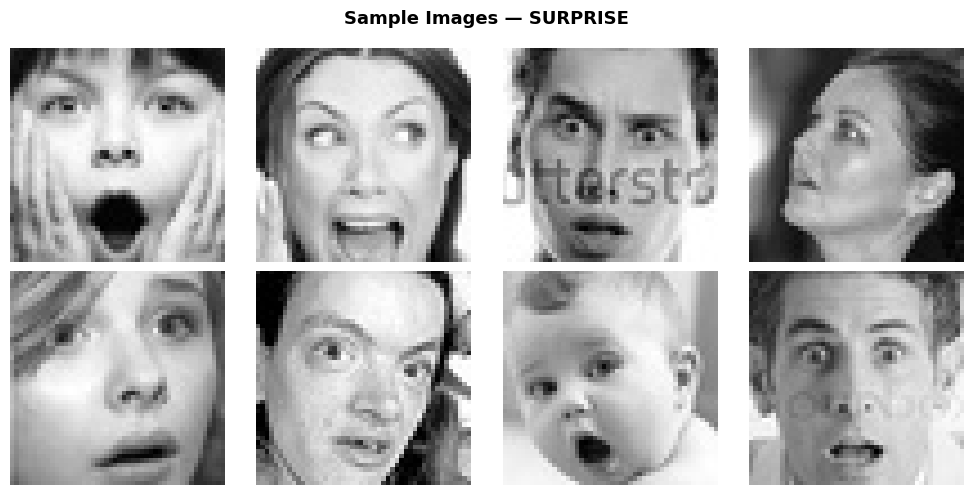
Sample Images by Class
😊 Happy😐 Neutral😔 Sad😮 Surprise
Model Architectures
Six architectures
Six architectures were evaluated in sequence, each motivated by the failures observed in the previous model. All share the same final classification head and training data pipeline.
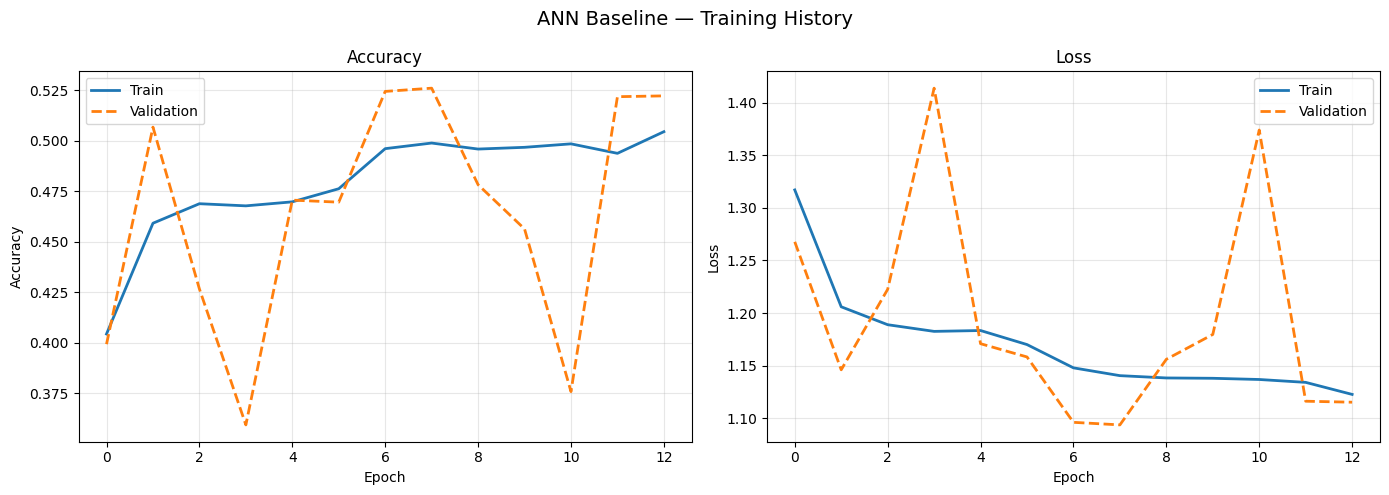
ANN baseline
A fully connected network with two hidden layers (256 and 128 units, ReLU, dropout 0.4/0.3). Treats each pixel as an independent feature — discarding all spatial relationships. EarlyStopping triggered at epoch 13.
Figure 4. ANN Baseline training history (15 epochs max, early stopped at epoch 13).
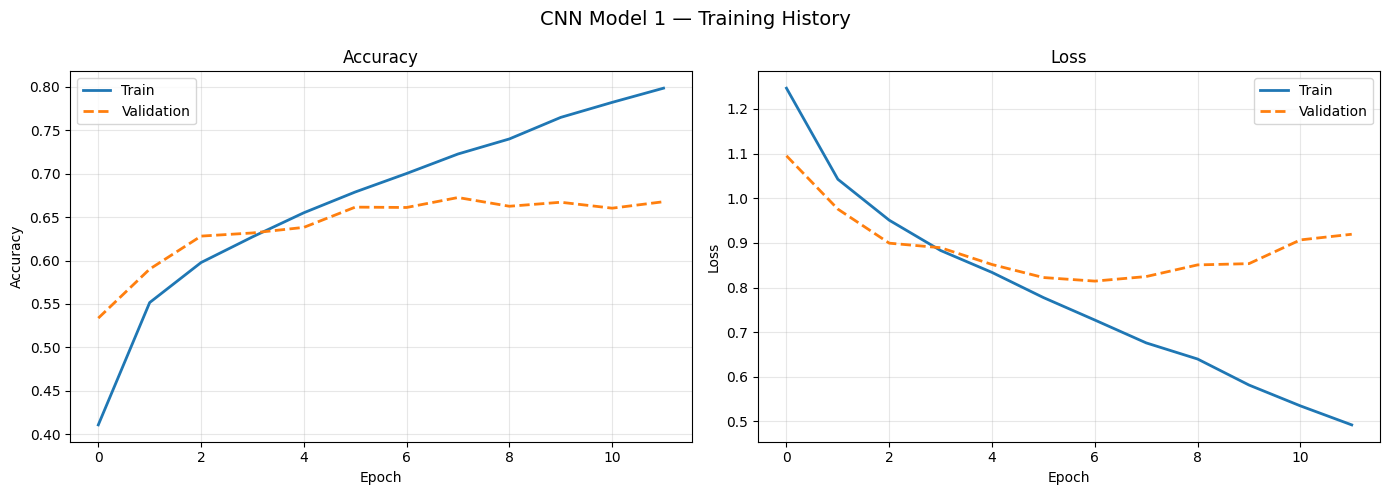
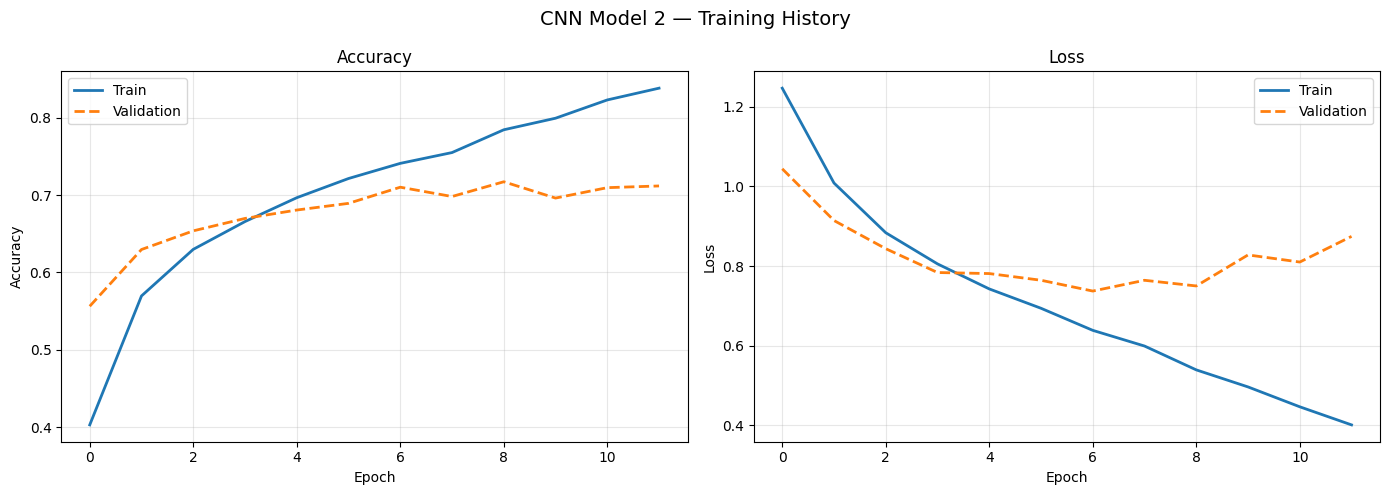
CNN Models 1 and 2
CNN Model 1 (2 conv blocks: 32→64 filters, MaxPooling, Dropout 0.25) introduces spatial feature detection. The +17.97 pp improvement over ANN quantifies the value of understanding where features occur on a face. CNN Model 2 adds a third block (128 filters), gaining +5.47 pp.
CNN Model 1 (69.53%)CNN Model 2 (75.00%)
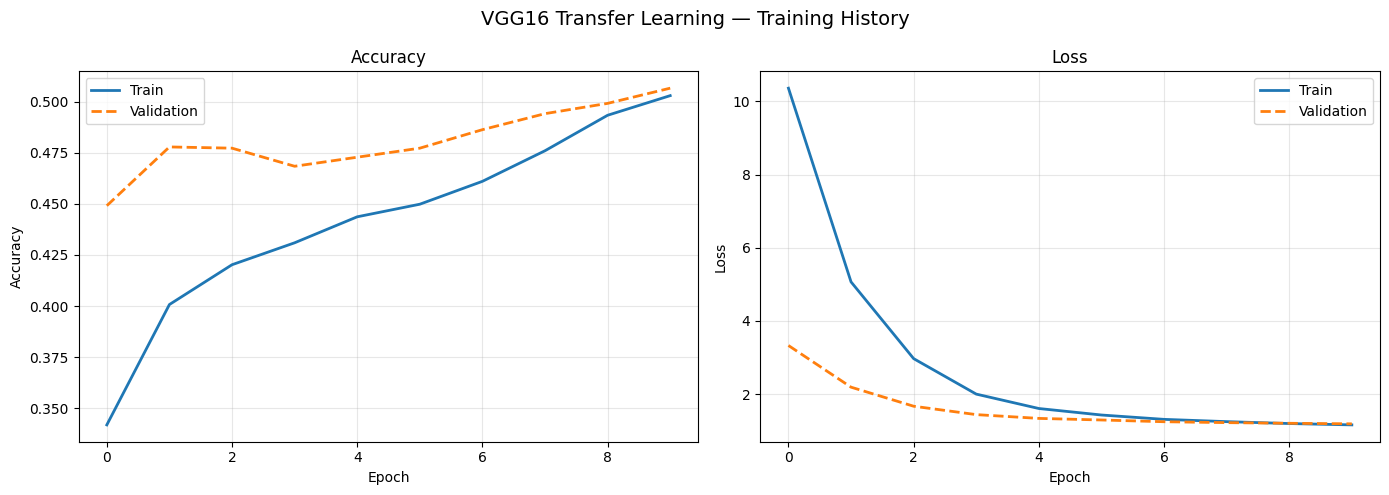
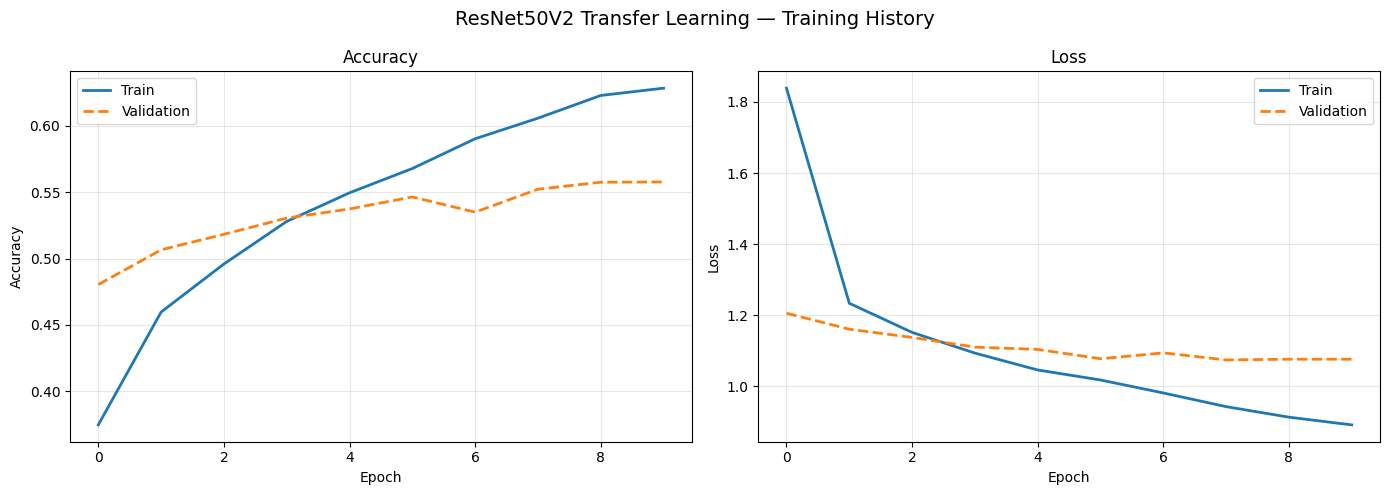
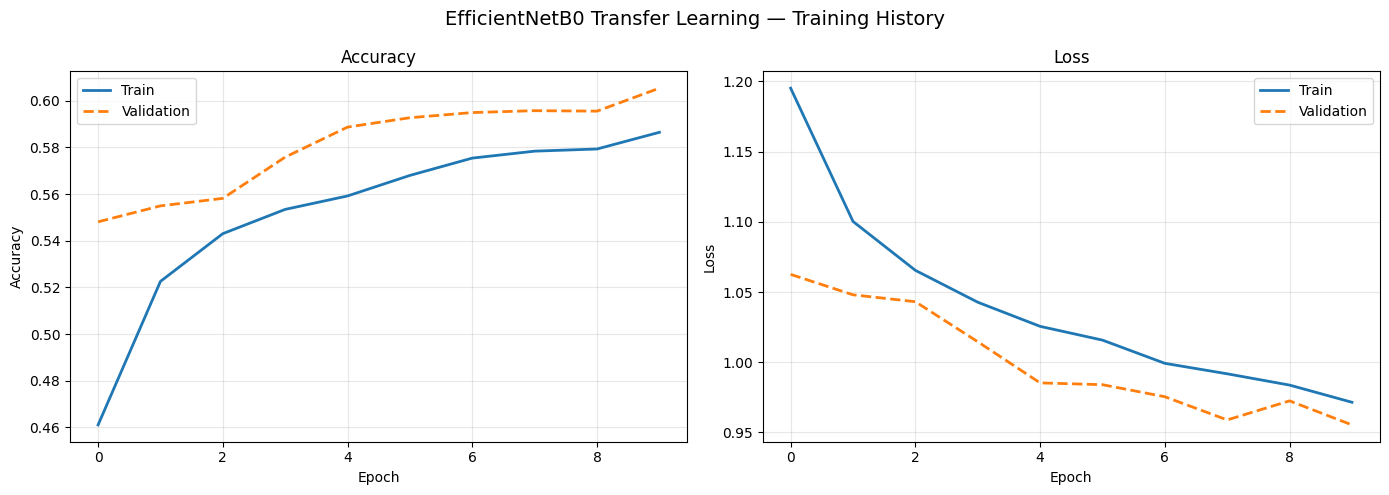
Transfer learning
Three ImageNet-pretrained architectures (VGG16, ResNet50V2, EfficientNetB0) with frozen base layers and custom classification heads. Despite hundreds of millions of parameters, all three underperformed CNN Model 1.
🔬
Three things compounded against all of them: the ImageNet features are tuned for high-res color object photos (domain gap), the models expect 224×224+ inputs so most spatial detail is gone at 48×48 (resolution mismatch), and grayscale replicated to 3 channels doesn't activate any of the color-sensitive features they were trained on (modality mismatch).
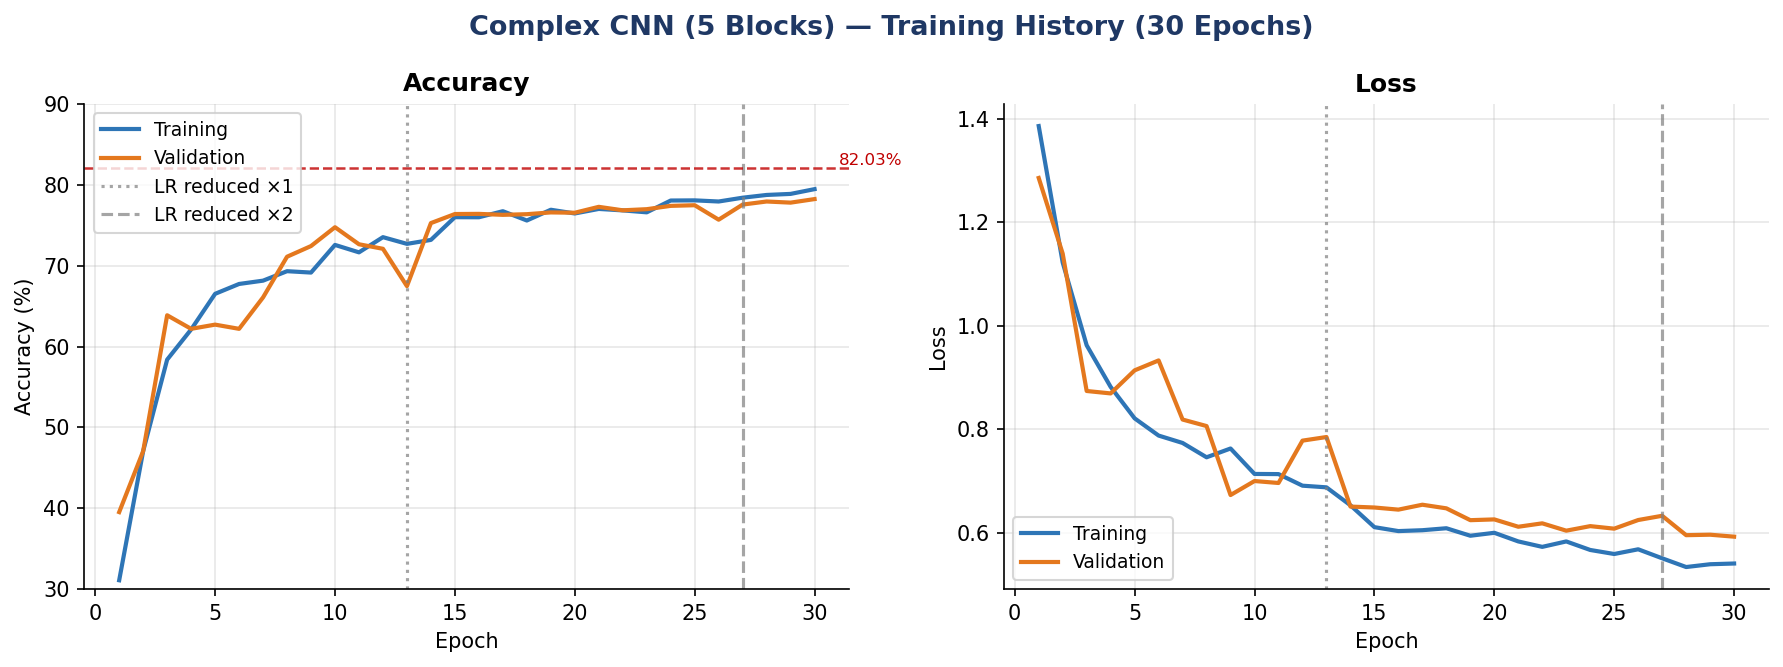
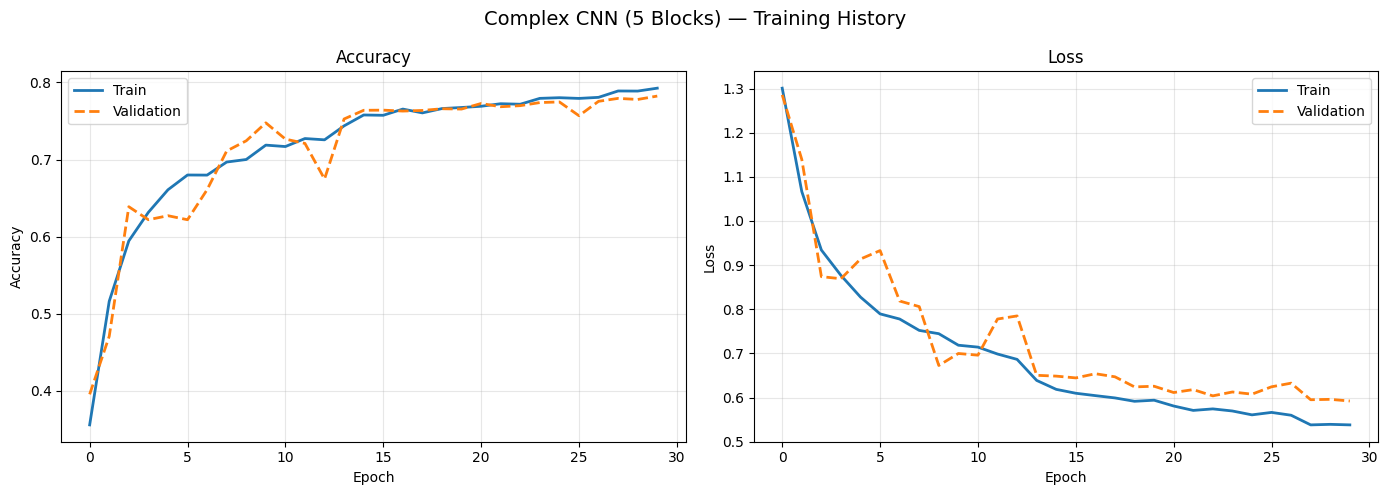
Designed specifically to address every failure mode in the experimental record. Five convolutional blocks (32→64→128→256→512 filters), Batch Normalization at every layer, data augmentation (rotation ±15°, zoom ±10%, horizontal flip), and ReduceLROnPlateau enabling 30 full epochs of improvement.
Figure 7. Complex CNN architecture overview with annotation.Complex CNN training history over 30 epochs with learning rate reduction events. Training accuracy continues improving through all 30 epochs — evidence that batch normalization and augmentation prevent premature convergence.
Results
+30.47 pp from ANN to Complex CNN
The full progression from ANN baseline to the Complex CNN, achieved entirely through architectural choices on the same training data.
Architecture
Test Accuracy
Test Loss
Macro F1
Category
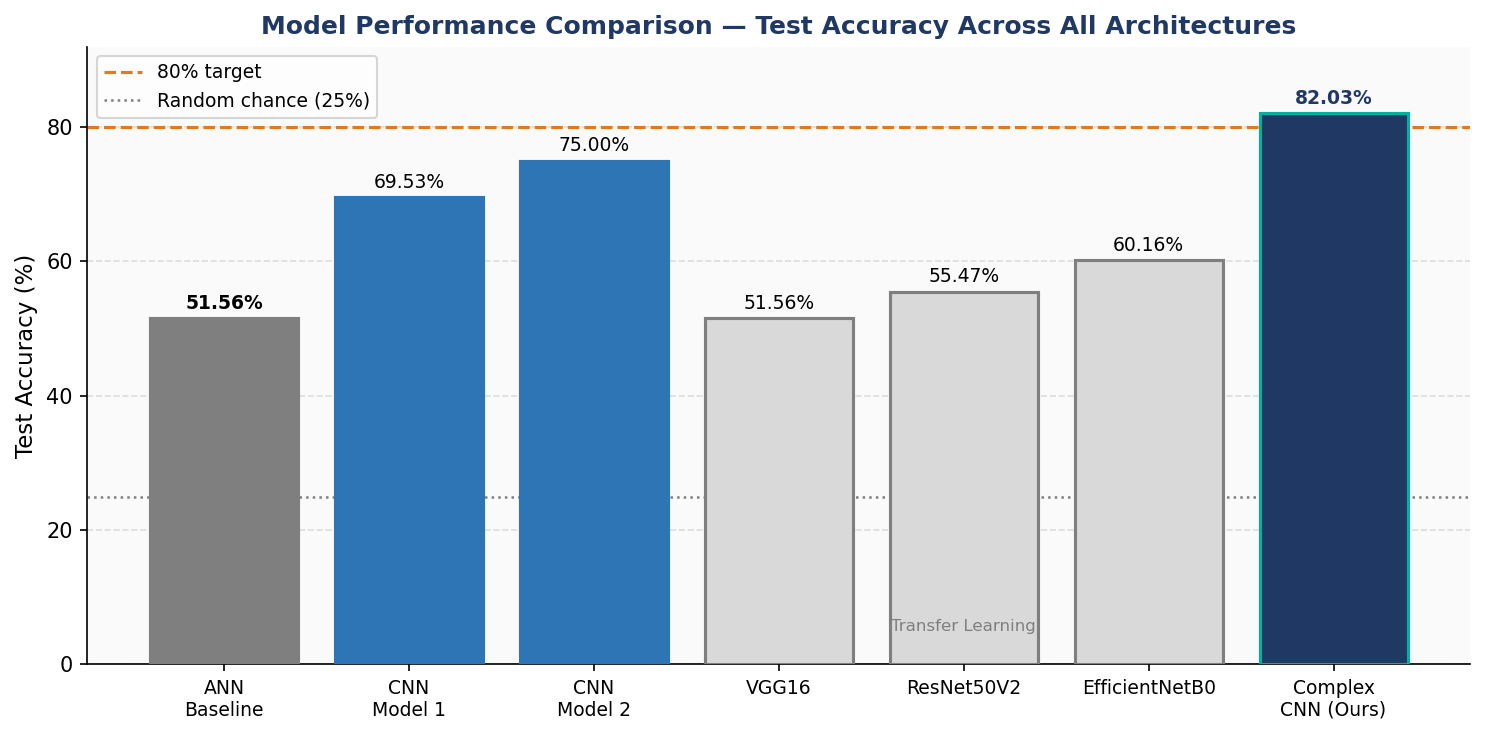
ANN Baseline
51.56%
1.1095
0.51
Baseline
VGG16
51.56%
1.1832
0.52
Transfer
ResNet50V2
55.47%
1.0878
0.55
Transfer
EfficientNetB0
60.16%
0.9352
0.59
Transfer
CNN Model 1
69.53%
0.7483
0.70
Custom CNN
CNN Model 2
75.00%
0.6780
0.75
Custom CNN
Complex CNN (Ours)
82.03%
0.5634
0.82
Final Model
Figure 8. Test accuracy across all architectures. Transfer learning models fail to exceed CNN Model 1, and the Complex CNN surpasses the 80% target.
Per-Class Performance — Complex CNN
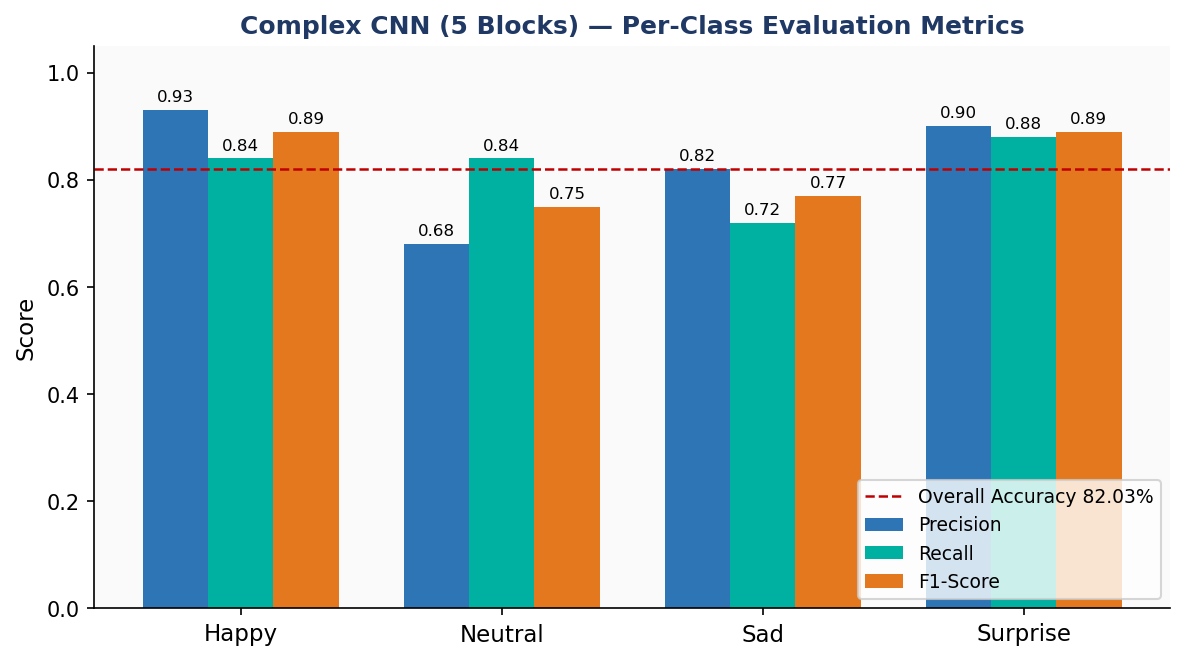
Strong performance on visually distinctive emotions; predictable challenge on the Neutral/Sad boundary.
😊 Happy — F1: 0.89P: 0.93 · R: 0.84
😮 Surprise — F1: 0.89P: 0.90 · R: 0.88
😔 Sad — F1: 0.77P: 0.82 · R: 0.72
😐 Neutral — F1: 0.75P: 0.68 · R: 0.84
Figure 9. Per-class Precision, Recall, and F1-Score for the Complex CNN.
Confusion Matrix
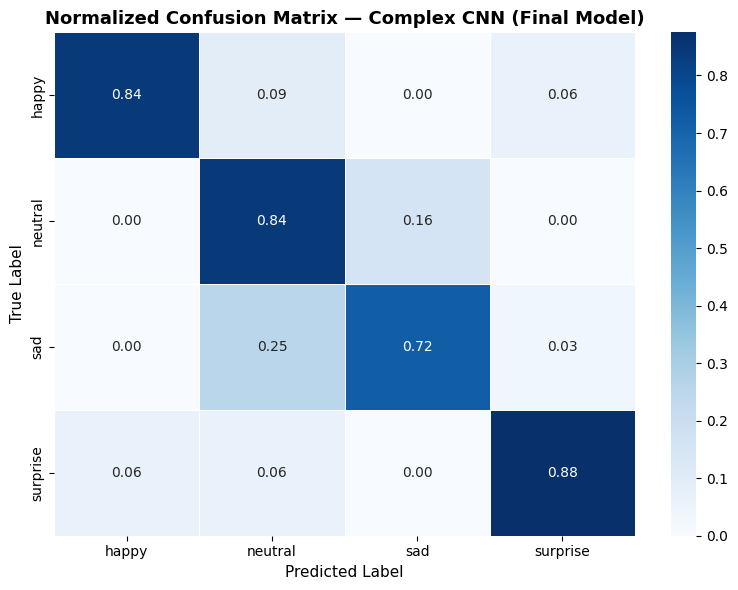
The primary confusion pair is Neutral ↔ Sad — consistent with the 3.27-point mean pixel intensity separation. Happy and Surprise dominate the diagonal with clear visual signals.
Figure 10. Confusion matrix for the Complex CNN on the 128-image test set (32 per class). The Neutral/Sad off-diagonal entries reflect the 3.27-point mean pixel intensity separation.
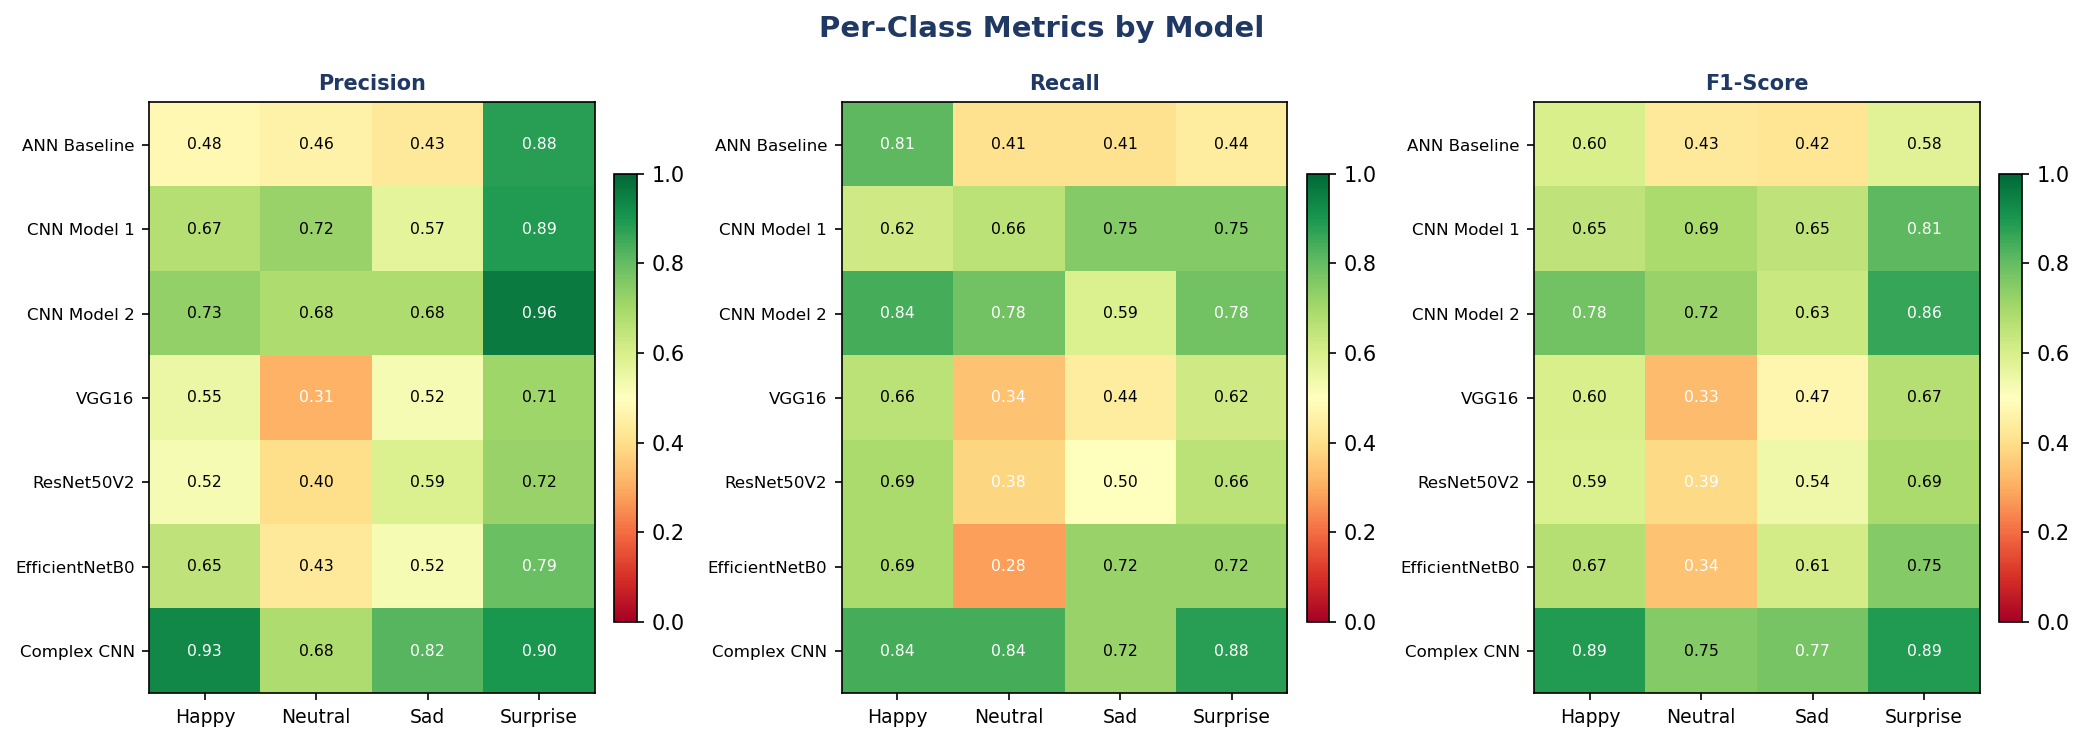
Cross-Architecture Per-Class Analysis
Figure 11. Per-class Precision, Recall, and F1-Score heatmaps across all seven architectures. Green = high performance, Red = poor. The Complex CNN improvement is visible across all metrics.
Key Insights
Six Lessons from the Experimental Record
1
Spatial structure is the enabling mechanism
The +17.97 pp jump from ANN (51.56%) to CNN Model 1 (69.53%) on identical data quantifies the value of spatial feature detection. Understanding where features appear on a face — not merely that they exist — is the core capability.
2
Depth and regularization must co-occur
CNN Model 2 plateaued early without batch normalization. The Complex CNN's 30-epoch continuous improvement demonstrates that batch normalization allows full exploitation of architectural depth.
3
Transfer learning underperformed on this domain
VGG16, ResNet50V2, and EfficientNetB0 — containing hundreds of millions of ImageNet-trained parameters — all underperformed CNN Model 1. Pre-training on the wrong domain is as limiting as no pre-training.
4
Engineering discipline is a real differentiator
A single preprocessing mismatch during EfficientNetB0 experiments caused complete model failure. Knowing each architecture's preprocessing contract is a non-trivial skill that compounds into results.
5
Surprise is the most learnable emotion at 48×48
Despite 20% fewer training samples, Surprise achieves F1 0.89 — equal to Happy. Its compound visual signal (raised brows + wide eyes + open jaw) provides redundant features that remain discriminative at low resolution.
6
The Neutral/Sad boundary is the central challenge — and the central safety target
The Complex CNN's resolution of this boundary (Neutral F1: 0.75, Sad F1: 0.77) compared to CNN Model 2 (0.72, 0.63) is the key advance for the driver monitoring application — these are the two states that determine fatigue detection.
Deployment Case Study
Open-Source Public Transportation DMS
The proposed deployment is an edge-inference driver monitoring system for public transportation fleets. All inference runs locally on an embedded device mounted inside the vehicle cab. No face images leave the vehicle during normal operation.
Hardware Stack — $500/vehicle Year 1
Component
Unit Cost
Notes
Raspberry Pi Camera Module 3 NoIR
$25
IR-capable, 12MP, designed for Pi 5
Raspberry Pi 5 (8GB RAM)
$80
Sufficient for real-time CNN inference
Waveshare SIM7600G-H 4G LTE HAT
$50
Cellular telemetry — event metadata only
Enclosure, power, mounting, alerts
$145
Off-the-shelf components
Total hardware
$300
Installation
$200
Fleet technician, one-time
Year 1 Total
$500/vehicle
+ ~$40–50/yr ongoing (cellular + maintenance)
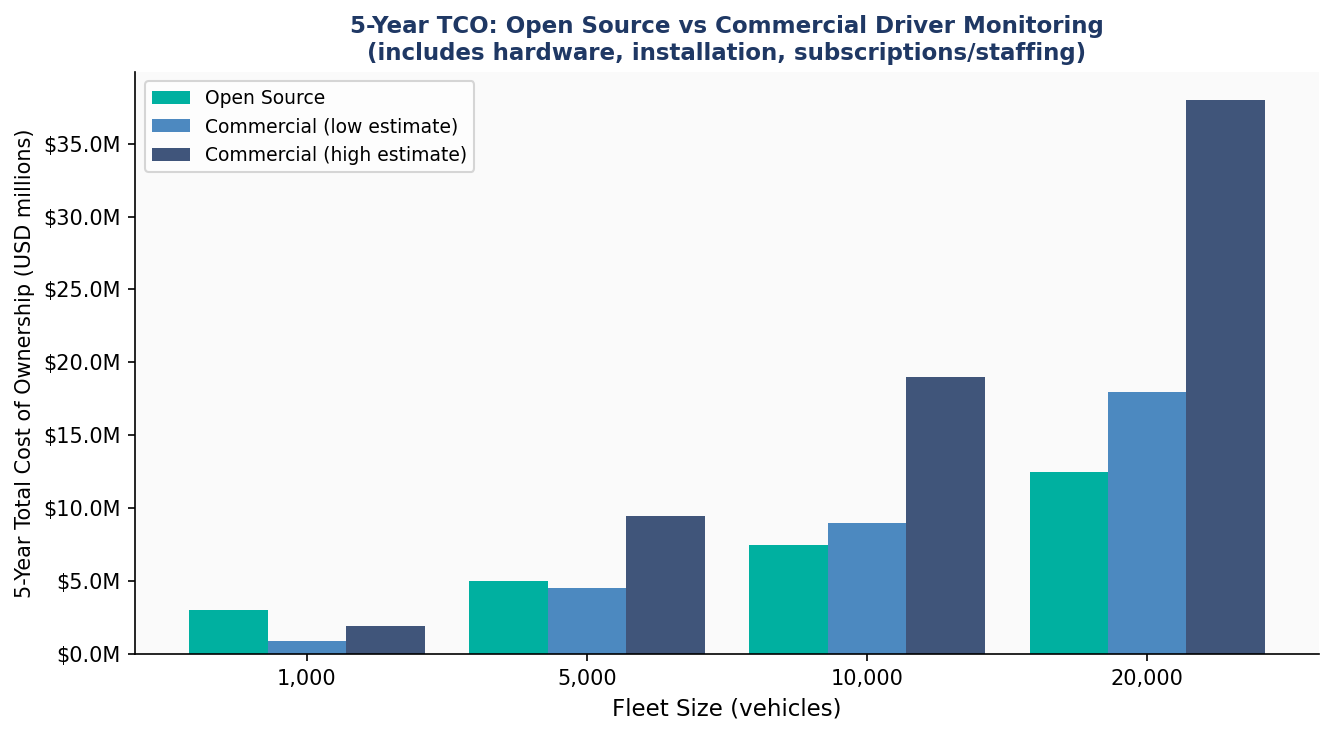
5-Year Total Cost of Ownership — 10,000 Vehicles
Open Source (This Model)
$7.5M
$500/vehicle Year 1 + $500K/year federal maintenance team. Zero subscription fees. Full auditability. Permanent public ownership.
Figure 12. 5-year Total Cost of Ownership: open-source vs. commercial estimates across fleet sizes. The open-source advantage grows with scale — at 10,000 vehicles, savings range from $5M to $21M over 5 years.
🏛️
Full auditability (any government body can inspect every inference decision) and sovereignty (no vendor lock-in; the IP stays in the public domain permanently). The EU GSR framework puts governments in an unusual position: they're both mandating this technology and operating the largest fleets that need it.
Limitations & Future Work
Known Gaps Before Production
Small test set
128 images (32/class). Results should be validated on a larger held-out set before production. Confidence intervals are wide at n=32.
Neutral/Sad performance
F1 0.75/0.77 — substantially improved, but not yet sufficient for standalone safety-critical decisions. Should function as one signal among several.
Demographic bias
Training data has not been independently audited across age, gender, and ethnicity. A bias audit with disaggregated metrics is required before public deployment.
No face detection
The model expects a pre-cropped, centered face. A separate upstream face detection step (MTCNN or OpenCV Haar Cascade) is required for video deployment.
Future directions
Higher resolution input (96×96 or 224×224) for more spatial detail on the Neutral/Sad boundary
Facial landmark features as additional model inputs — encoding geometry of mouth corners and brow elevation
Real-time video pipeline with temporal smoothing: ≥3 consecutive frames before triggering an alert
Domain-specific pre-training on large-scale FER datasets (AffectNet, RAF-DB)
Government consortium model: multiple transit agencies sharing architecture and jointly funding a maintenance team
Conclusion
Conclusion
A purpose-built convolutional neural network significantly outperforms transfer learning approaches for facial emotion recognition on domain-specific low-resolution grayscale data. The Complex CNN achieves 82.03% test accuracy and Macro F1 of 0.82 — exceeding the project target and outperforming EfficientNetB0 by 21.87 percentage points.
✅
Domain alignment matters more than model size — ImageNet features don't transfer to 48×48 grayscale facial expressions.
Depth and regularization have to work together — batch normalization is what let the model keep improving across all 30 epochs, where the simpler architectures stalled out.
Evidence-based iteration compounds — every architectural choice in the Complex CNN traces back to a specific failure in the experimental record.
The model is technically deployable today as a supporting signal within a multi-sensor safety system — pending bias auditing and validation on a larger held-out dataset.